Open Telemetry with multiple NestJS apps
and logs as Open Telemetry tracing events
The following article will expand further on https://www.tomray.dev/nestjs-open-telemetry and show how it works with a couple of NestJS apps together and also make logs appear in your distributed traces. Follow Tom’s guide for a detailled
Please refer to https://github.com/alexknips/nest-open-telemetry for the actual code. Feel free to use the code under the MIT license.
From there I created multiple NestJS apps to showcase how distributed tracing has real benefits.
Each NestJS app builds a Docker Container and they can be run together as
version: '3.7'
services:
  jaeger:
    image: jaegertracing/all-in-one:latest
    ports:
      - "16686:16686"
      - "4318:4318"
      - "4317:4317"
    environment:
      - LOG_LEVEL=debug
    networks:
      - jaeger-example
  nestapp1:
    image: nestapp1
    build:
      context: nest1
      dockerfile: Dockerfile
    ports:
      - "3001:3000"
    environment:
      - OTEL_EXPORTER_OTLP_ENDPOINT=http://jaeger:4318
    networks:
      - jaeger-example
    depends_on:
      - jaeger
      - nestapp2
      - nestapp3
  nestapp2:
    image: nestapp2
    build:
      context: nest2
      dockerfile: Dockerfile
    ports:
      - "3002:3000"
    environment:
      - OTEL_EXPORTER_OTLP_ENDPOINT=http://jaeger:4318
    networks:
      - jaeger-example
    depends_on:
      - jaeger
      - nestapp3
  nestapp3:
    image: nestapp3
    build:
      context: nest3
      dockerfile: Dockerfile
    ports:
      - "3003:3000"
    environment:
      - OTEL_EXPORTER_OTLP_ENDPOINT=http://jaeger:4318
    networks:
      - jaeger-example
    depends_on:
      - jaeger

networks:
  jaeger-example:
Here we configure one container jaeger for the Jaeger distributed tracing backend. Please be aware that this can be replaced by any other tracing backend of your choice that is compatible with OpenTelemetry, Datadog is another example. I also want to take the chance to remind everyone that OpenTelemetry is a standard and not a service. However te community provides SDKs for the standard. But it does not come with its own tracing backend. We configure a couple of ports for jaeger. 4318 is used for OpenTelemetry interaction through http and 4317 for OpenTelemetry through grcp. 16686 is the port for the Jaeger UI.
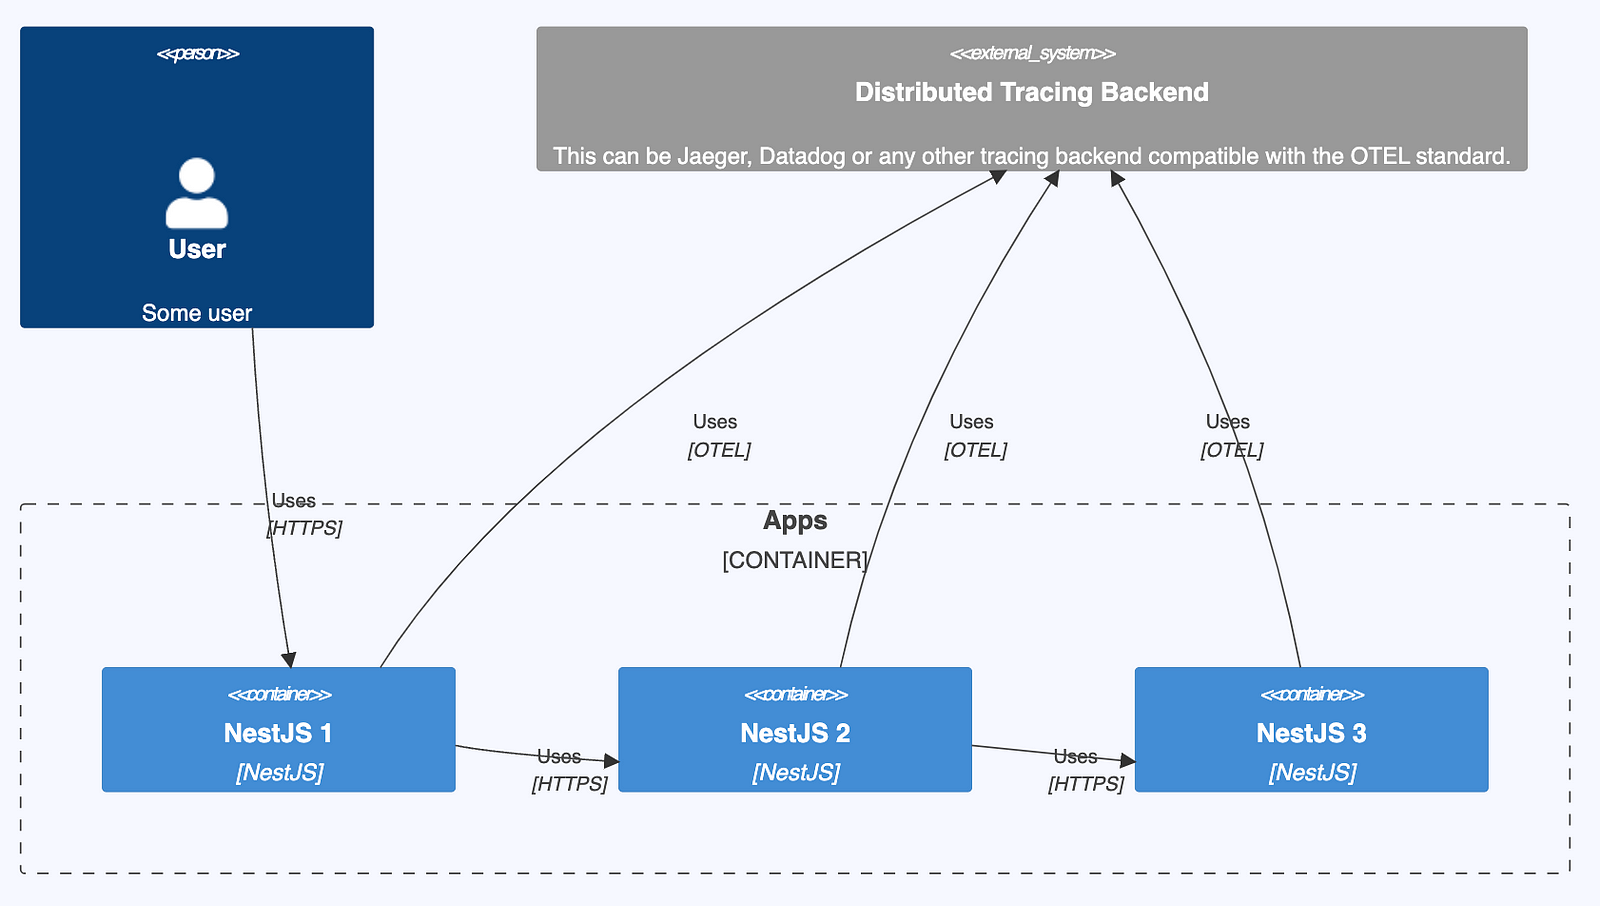
The system of the services can be explained through a container diagram that I created following the C4 model standard in Mermaid.JS
C4Container
    title System Contain diagram: OpenTelemetry with multiple NestJS apps

    Person(user, User, "Some user", "...")
    System_Ext(tracingBackend, "Distributed Tracing Backend", "This can be Jaeger, Datadog or any other tracing backend compatible with the OTEL standard.")

    Container_Boundary(c1, "Apps") {
        Container(nest1, "NestJS 1", "NestJS")
        Container(nest2, "NestJS 2", "NestJS")
        Container(nest3, "NestJS 3", "NestJS")
        Rel(nest2, nest3, "Uses", "HTTPS")
        Rel(nest1, nest2, "Uses", "HTTPS")
        Rel(user, nest1, "Uses", "HTTPS")
    }

    Rel(user, nest1, "Uses", "HTTPS")
    Rel(nest1, tracingBackend, "Uses", "OTEL")
    Rel(nest2, tracingBackend, "Uses", "OTEL")
    Rel(nest3, tracingBackend, "Uses", "OTEL")

So in this example the User calls the micro-service NestJS 1 which in turn calls NestJS 2 which in turn calls NestJS 3. Let’s not go into whether this is a good design or but how distributed tracing can be set up and help debug performance issues and how one call leads to a long chain of interactions between micro-services.
Each NestJS micro-service contains a tracer.ts to connect to the tracing backend through the OpenTelemetry protocol.
'use strict';

import { OTLPTraceExporter } from '@opentelemetry/exporter-trace-otlp-grpc';
import { Resource } from '@opentelemetry/resources';
import { NodeSDK } from '@opentelemetry/sdk-node';
import { SemanticResourceAttributes } from '@opentelemetry/semantic-conventions';
import { NestInstrumentation } from '@opentelemetry/instrumentation-nestjs-core';
import { HttpInstrumentation } from '@opentelemetry/instrumentation-http';
import { ExpressInstrumentation } from '@opentelemetry/instrumentation-express';

// Configure the SDK to export telemetry data to the console
// Enable all auto-instrumentations from the meta package
const exporterOptions = {
  url: 'http://jaeger:4317', // grcp
};

const traceExporter = new OTLPTraceExporter(exporterOptions);

const sdk = new NodeSDK({
  traceExporter,
  instrumentations: [
    // getNodeAutoInstrumentations(),
    new NestInstrumentation(),
    new HttpInstrumentation(),
    new ExpressInstrumentation(),
  ],
  resource: new Resource({
    [SemanticResourceAttributes.SERVICE_NAME]: 'nest1',
  }),
});

// initialize the SDK and register with the OpenTelemetry API
// this enables the API to record telemetry
sdk.start();

// gracefully shut down the SDK on process exit
process.on('SIGTERM', () => {
  sdk
    .shutdown()
    .then(() => console.log('Tracing terminated'))
    .catch((error) => console.log('Error terminating tracing', error))
    .finally(() => process.exit(0));
});

export default sdk;
After the imports for the OpenTelemetry SDK, we configure the exporter options. Here you can also choose the HTTP backend. We then wrap the actual exporter.
Instrumentations are configured through
instrumentations: [
    // getNodeAutoInstrumentations(),
    new NestInstrumentation(),
    new HttpInstrumentation(),
    new ExpressInstrumentation(),
  ],
and the resource defines the name of our micro-service to appear in the tracing. Afterwards the tracing is started and properly awaited and logged.
The actual startup of the NestJS app is main.ts
import { NestFactory } from '@nestjs/core';
import { AppModule } from './app.module';
import tracer from './tracer';

async function bootstrap() {
  // Start SDK before nestjs factory create
  await tracer.start();

  const app = await NestFactory.create(AppModule);
  await app.listen(3000);
}
bootstrap();
We can now start all apps together through executing docker compose up --build
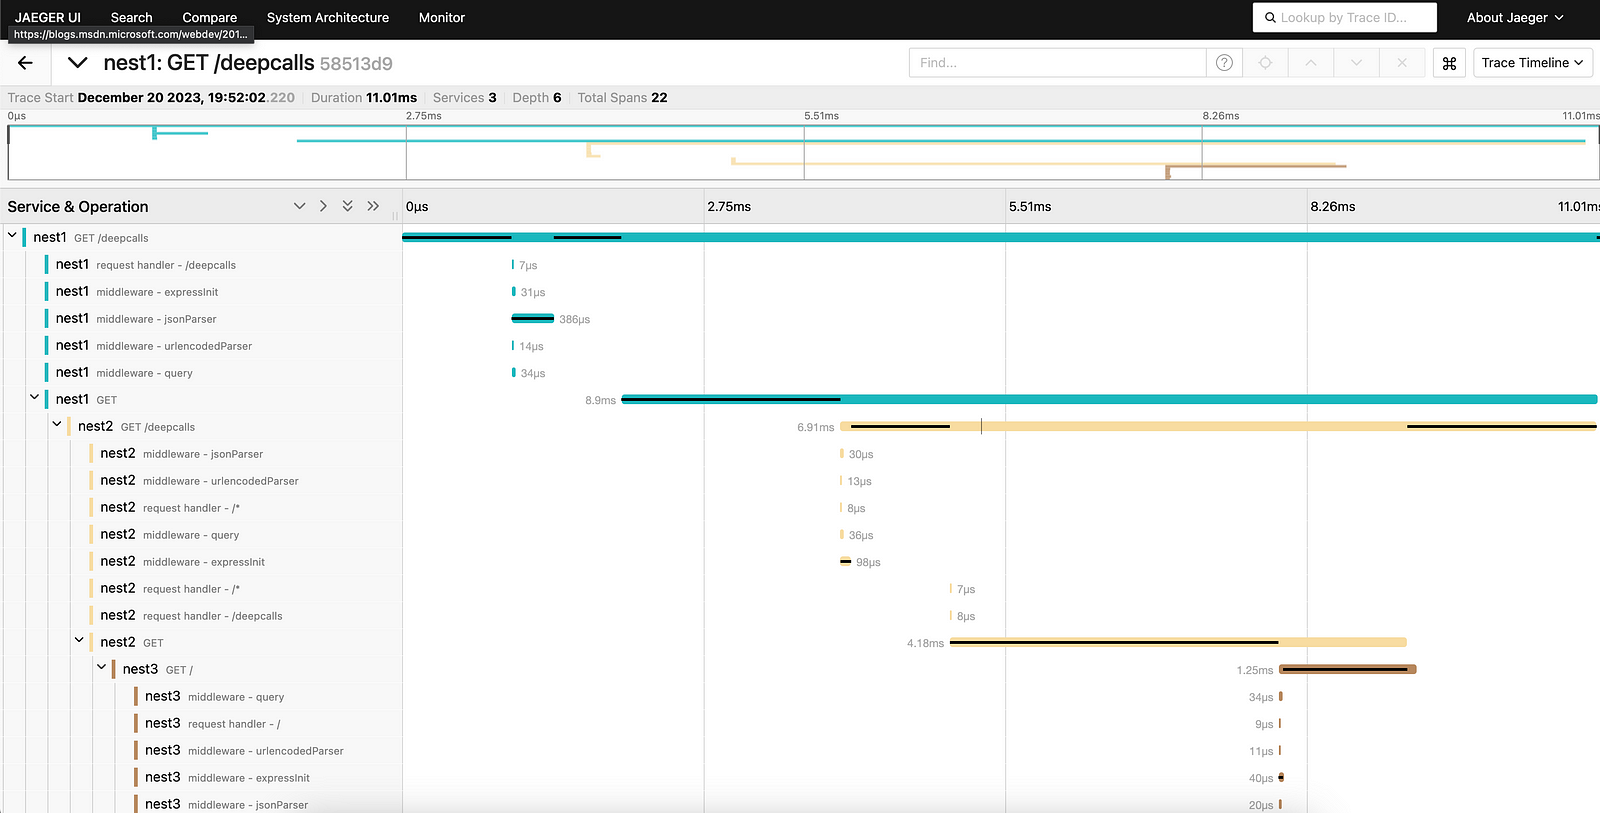
Let’s take a look at Jaeger at http://localhost:16686/

You can see how the call to Nest1 goes to Nest2 and then to Nest3 to return again to Nest2 and then to Nest1.
The long bars represent Spans as explained in detail in the OpenTelemetry docs https://opentelemetry.io/docs/concepts/signals/traces/.
Open Telemetry Logs
The OpenTelemetry specification allows us to enhance the traces with logs, also called events and explained in detail in https://opentelemetry.io/docs/concepts/signals/logs/.
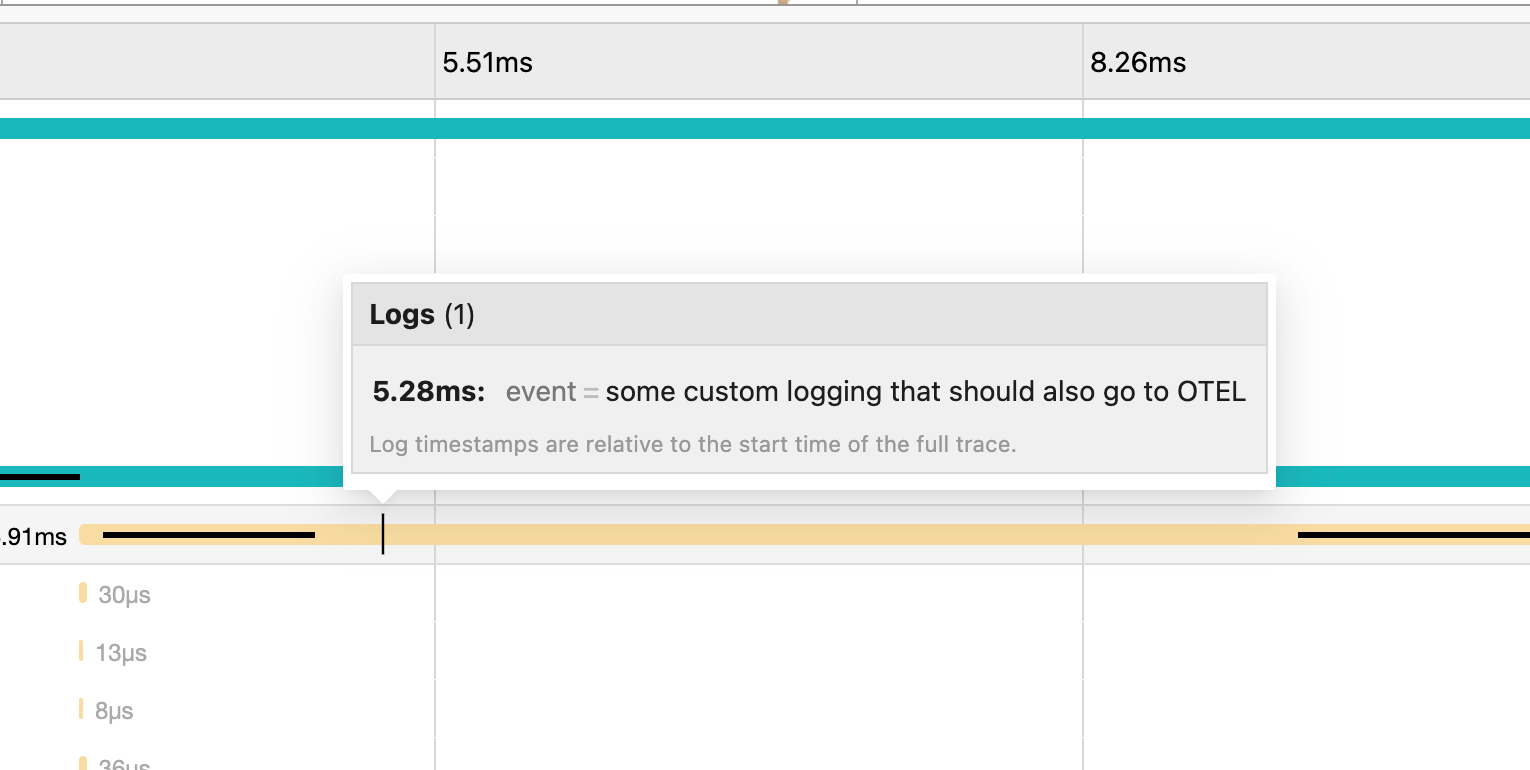
While a Span represents a process with a starting and ending time, an Event present a single point in time. As such logs are events.
In the repo linked above we also show how to enhance the traces with logs. This is then represented as a vertical bar on the trace as seen below. The time shown here as 5.28ms is relative to the parent span.

How do we achieve this?
We create a custom logger
import { Injectable, Scope, ConsoleLogger } from '@nestjs/common';
import api from '@opentelemetry/api';

@Injectable({ scope: Scope.TRANSIENT })
export class MyLoggerService extends ConsoleLogger {
  customLog(message: string) {
    const activeSpan = api.trace.getSpan(api.context.active())
    activeSpan.addEvent(message)
    this.log(message);
  }
}
that takes the log message and injects it into the active span as an event. This is obviously not production-ready but can easily be extended and modified.
Just make sure there are two different approaches and goals:
Inject logs into the distributed tracing as seen above
Give each log a tracing id such that you can find the trace that belong to a specific log message (sometimes in a different system). Pino instrumentation (https://www.npmjs.com/package/@opentelemetry/instrumentation-pin) achieves this but not the first.
For production-ready you would probably customize a logger such as pino instead of extending ConsoleLogger.
Thanks for reading, Alex.